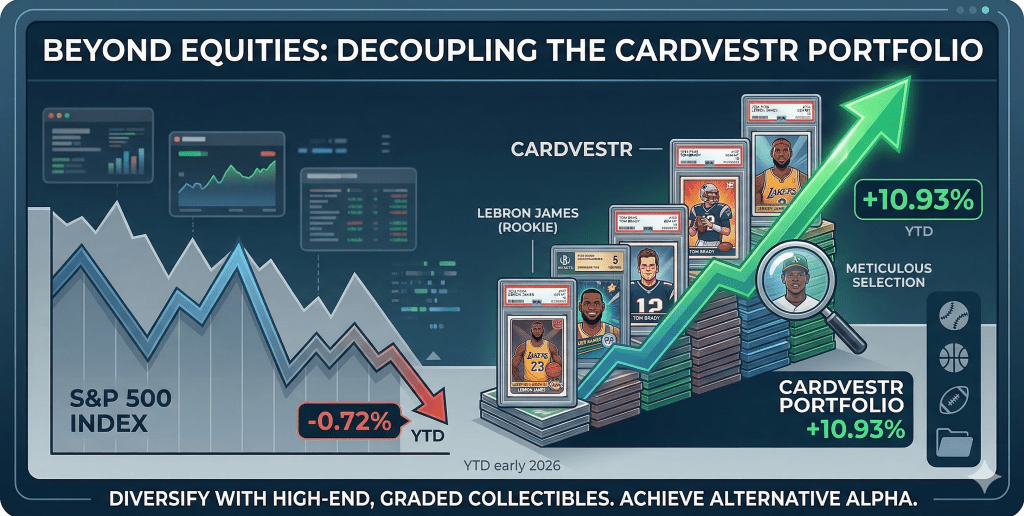
The Case for Alternative Alpha: Why Sports Cards Are Outperforming the S&P 500 in 2026
As we move through the first quarter of 2026, the traditional equity markets are struggling to find a consistent footing. Financial advisors and portfolio managers are increasingly looking beyond the standard 60/40 allocation to find true “Alpha”—returns that are not only market-beating but also uncorrelated to the broader volatility of the S&P 500.
The Cardvestr portfolio is demonstrating exactly how meticulous asset selection in the alternative space can provide a significant hedge against equity stagnation. While the S&P 500 has retreated into negative territory YTD, the Cardvestr portfolio has continued its upward trajectory, widening the performance gap to nearly 1,200 basis points.
The Performance Gap: Data Analysis
A look at the current market data highlights a stark divergence in performance.
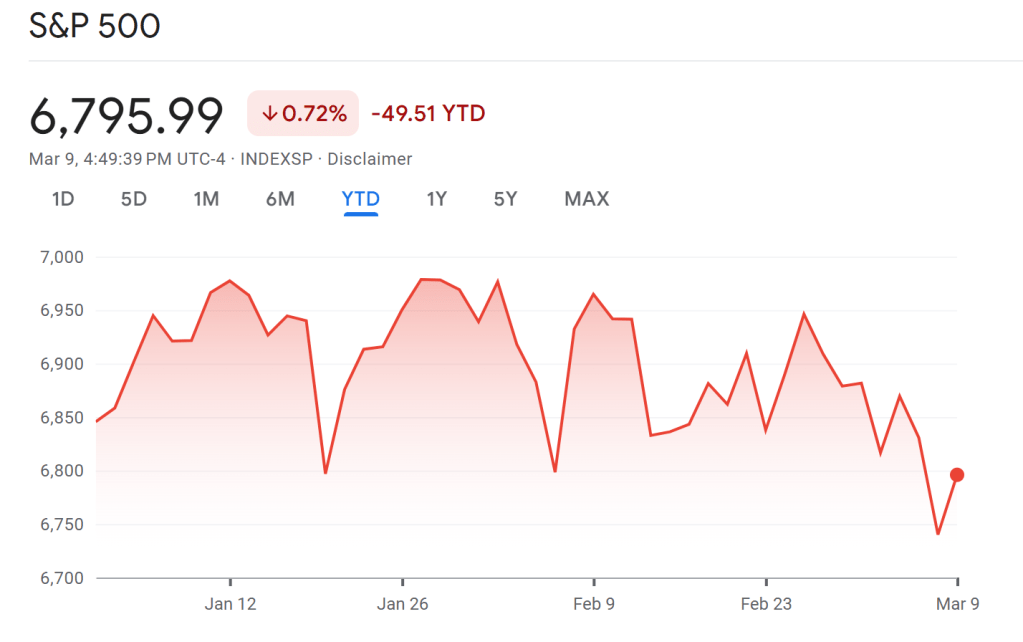
The S&P 500 Performance (YTD):
The broader market has faced a choppy start to the year. As of early March, the index sits at 6,795.99, representing a -0.72% decline YTD. The technical chart shows a pattern of lower highs and lower lows, with significant volatility around the late January and mid-February marks. For advisors, this represents “dead money” and increased risk without the reward of appreciation.
The Cardvestr Portfolio Performance (YTD):
In contrast, the Cardvestr portfolio has seen a steady, disciplined climb. Currently valued at $4,406.41 against a total investment of $3,972.40, the portfolio is up +10.93% YTD.
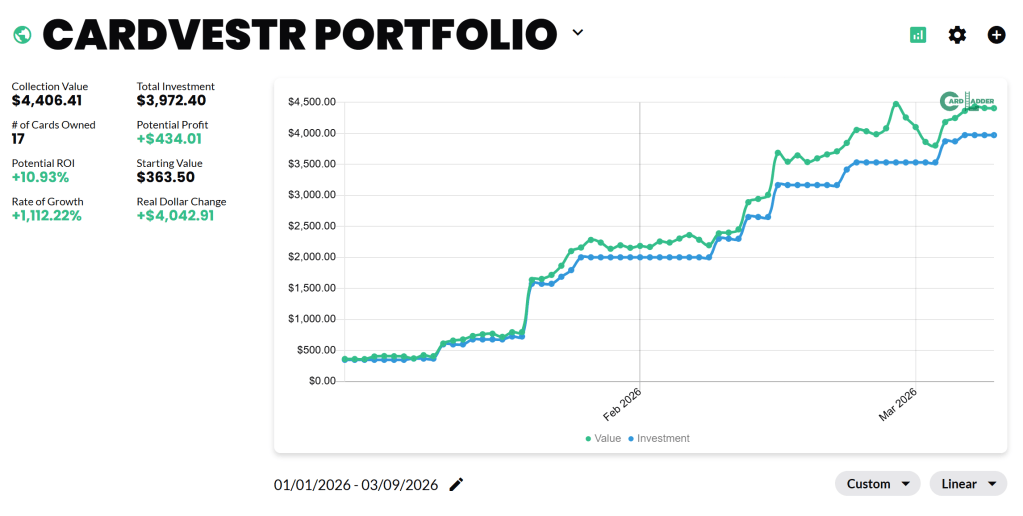
Key Metrics from the Cardvestr Growth Chart:
- Rate of Growth: +1,112.22% (Annualized/Projected)
- Unrealized Margin: The “Value” line (green) has consistently decoupled from the “Investment” line (blue), indicating that even as capital is deployed, the underlying assets are appreciating faster than the acquisition cost.
- Concentration: With 17 carefully selected cards, the portfolio maintains a high-conviction approach rather than “indexing” the entire hobby, which allows for superior price discovery.
Strategic February Additions: Betting on Blue Chips
The outperformance seen in February was driven by a pivot toward “Blue Chip” historical assets that carry intrinsic value regardless of interest rate hikes or corporate earnings reports. The focus remained on high-grade examples (both PSA and BGS) of “GOAT” level athletes.
Several key acquisitions in February served as the catalyst for this growth:
- The Vintage Backbone: Acquisitions of Rickey Henderson and Joe Montana cards provided a stable floor. These are “Blue Chip” legacy assets. In a market where tech stocks might fluctuate based on a single earnings call, a high-grade Rickey Henderson rookie remains a finite, historical artifact with a decreasing supply of high-grade examples.
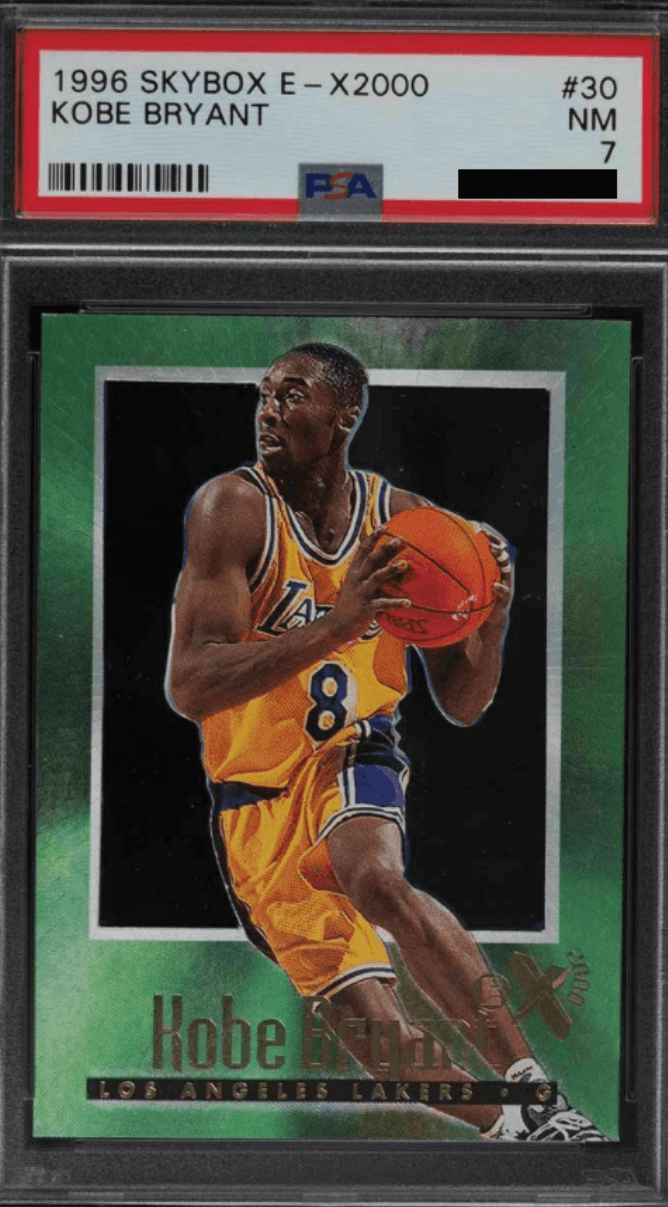
- Modern Legends: The inclusion of LeBron James and Kobe Bryant assets added a layer of modern liquidity. These athletes represent the pinnacle of the “Basketball Gold Standard,” and their market demand is global, providing a buffer against domestic economic cooling.
- The Quarterback Premium: Strategic entries into Tom Brady cards continued to pay dividends. As the most collected athlete in the modern era, Brady assets function almost like a “Reserve Currency” within the sports card market—highly liquid and consistently in demand.
- Multi-Sport Diversification: By adding names like Ken Griffey Jr. and Derek Jeter, the portfolio captured the seasonal “Spring Training” bump in baseball assets, further diversifying the risk across different sports calendars.
Why This Matters for Card Investors
For the modern advisor, the Cardvestr model offers three critical takeaways:
- Low Correlation: The price action of a PSA 10 Derek Jeter rookie is fundamentally untethered from the P/E ratios of the Magnificent Seven. When the S&P 500 dips, high-end collectibles often hold their value or appreciate as capital seeks “hard asset” safe havens.
- Scarcity Value: Unlike equities, which can be diluted through secondary offerings, the population of a BGS 9.5 Jerry Rice rookie is fixed. We are investing in “Absolute Scarcity.”
- Meticulous Selection over Speculation: The +10.93% return isn’t the result of “flipping” speculative modern prospects. It is the result of acquiring established, graded legends with a proven history of long-term appreciation.
Looking Ahead
As we move deeper into March, the goal remains the same: identify undervalued “Blue Chip” assets that the broader market has overlooked. The spread between the S&P 500 (-0.72%) and Cardvestr (+10.93%) is not an anomaly; it is the result of a disciplined, data-driven approach to alternative investing.
In a world where traditional markets are increasingly volatile, the “Cardvestr Barometer” is proving that alpha isn’t just found on Wall Street—it’s found in the meticulous selection of history.
The full Cardvestr portfolio.


Leave a comment