With just four days remaining in January, our strict monthly budget of $2,000 has a little over $570 remaining.
My goal is to never chase “hype” cards and only focus on blue-chip cards. Some may say my investment strategy is “boring” or way too conservative, but we like to adopt a blue-collar mentality. We work hard for our money and like to minimize risk on all card investments.
Our focus is on proven cards that have shown a considerable ROI over the last few years. Here at Cardvestr, I am a huge fan of Michael Jordan cards. The market is hot, has been hot, and looks to remain hot in the future.
With over $500 remaining in our January budget, my plan is to invest in Jordan cards in quantity, hoping each of the cards shows a continued increase in value.
If you’ve been watching the Michael Jordan market from the sidelines, you might think you missed the boat. The ’86 Fleer is trading for the price of a luxury sedan. The ’84 Star is untouchable. But if you look closer at the data—specifically the Card Ladder MJ Index over the last 22 months—you’ll see something different. You’ll see a market that isn’t just “up”; it is currently undergoing a violent upward repricing event.
At Cardvestr, I don’t argue with charts. We ride them.
Today, we executed a “Baby Aristocrat” strategy, acquiring five key Michael Jordan cards to capture the spillover from this massive Bull Run. Here is the data that drove the decision.
Exhibit A: The “Hockey Stick” (Index Data)

We pulled the Card Ladder Index for Michael Jordan spanning March 2024 to January 2026. The numbers are staggering.
- Starting Value (Mar ’24): 14,471
- Current Value (Jan ’26): 28,939
- Total Growth: +99.97%
Look at that curve. For the first year (2024), the market was in accumulation mode—slow, steady, chopping sideways. Then, around July/August 2025, the slope changed. The line went parabolic.
In less than two years, the aggregate value of the Michael Jordan market has literally doubled. This is what we call a “repricing event.” It means the floor has been raised. When the blue chips (PSA 10 Rookies) double, they pull the mid-range market up with them. That is where we are striking today.
Exhibit B: The Liquidity Explosion (Sales Volume)
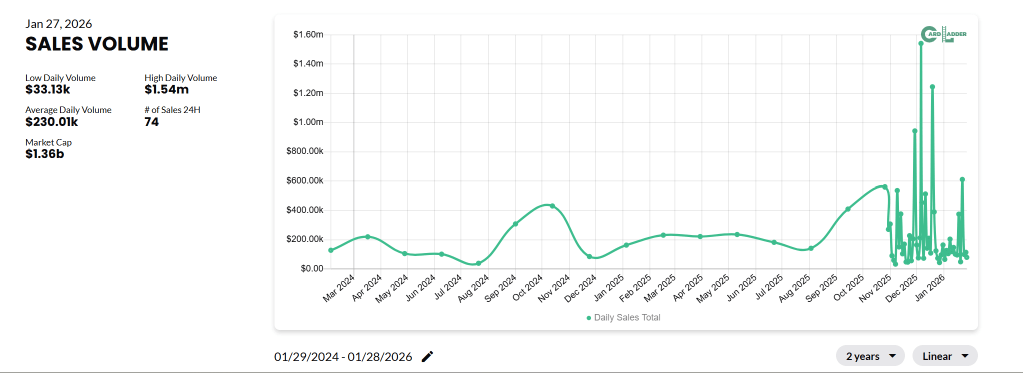
Price growth is great, but liquidity is what makes an investment safe. The Sales Volume graph for the last two years tells the real story of 2026.
- The “Sleepy” Phase: For most of 2024 and early 2025, daily volume hummed along at $200k-$300k. Healthy, but standard.
- The “Awakening”: Look at November 2025 through January 2026.
- The Spike: We are seeing massive vertical liquidity spikes, with a High Daily Volume hitting $1.54 Million.
This volatility is a buy signal. It means money is velocity-trading Jordan assets. The “smart money” is moving fast, clearing out supply. When daily volume spikes 5x-10x over the average, it creates a vacuum that sucks up inventory. We want to own that inventory before the dust settles.
The Acquisition: The “Baby Aristocrat” Ladder
To capitalize on this data without spending $50,000, we built a “Ladder Portfolio” of 5 graded cards. These assets offer exposure to the Jordan brand at a price point that has not yet fully realized the +99% growth of the index.
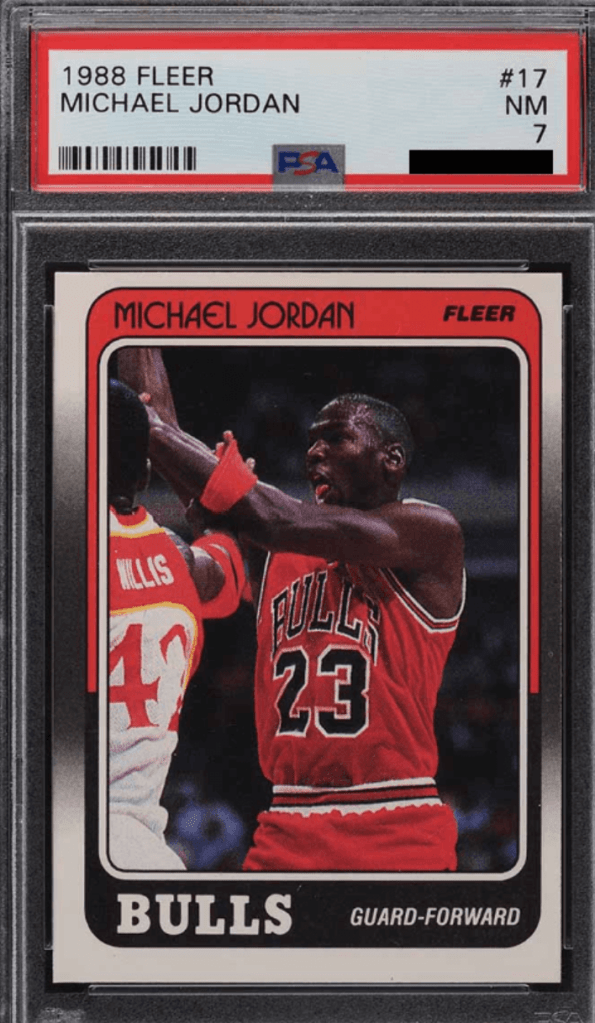
1. The “Vintage” Anchor: 1988 Fleer #17 (PSA 7)
- The Logic: This is a 3rd-year card. In a world where the ’86 Rookie is six figures, the ’88 is the next logical step for priced-out investors. A PSA 7 is liquid cash. We aren’t looking at a multiplier here; we are looking at Access. For a new collector entering the hobby in 2026, this is the only pre-1989 Jordan they can afford. That creates a permanent “floor” on the price. It is a defensive asset that will never go to zero.
- Purchase price: $107.50
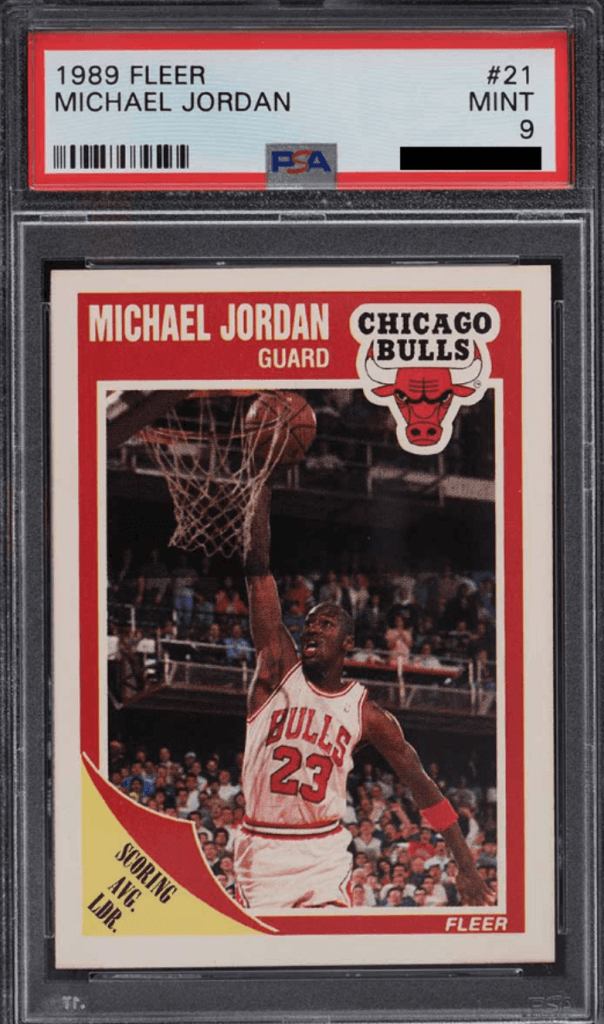
2. The “Mint” Volume Play: 1989 Fleer #21 (PSA 9)
- The Logic: 4th Year. Mint condition. This is the “high volume” play. As the index rises, these accessible Mint 9s are the first place new money lands. The PSA 10 price proves that demand outstrips supply, even at high volumes. A 20x multiplier is absurd for a standard issue card. This suggests the PSA 9 is critically undervalued purely on a “cost of entry” basis. It is the safest place to park $85 in the entire hobby.
- Purchase price: $77.89
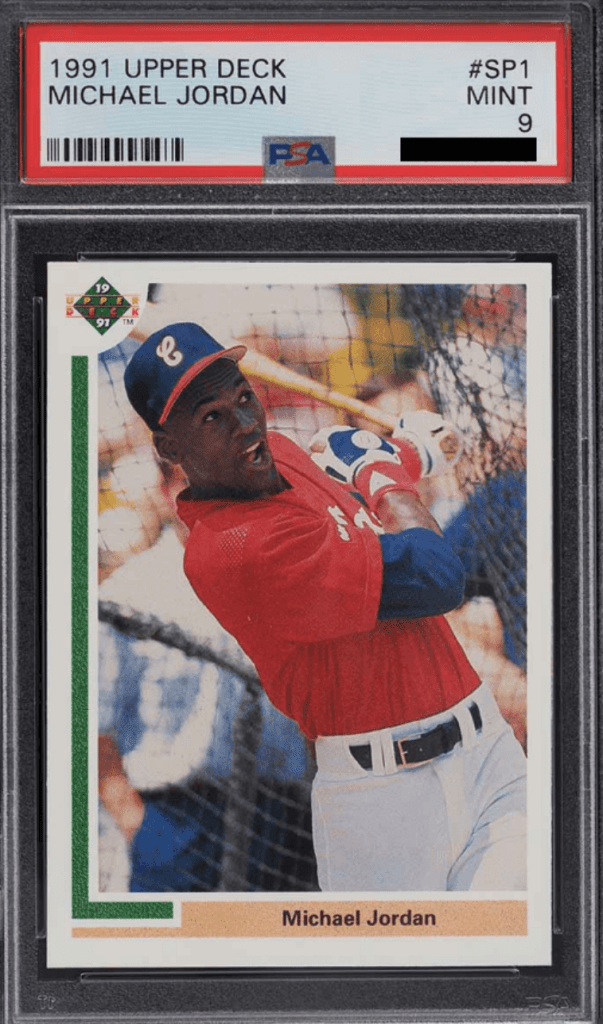
3. The Narrative Play: 1991 Upper Deck Baseball #SP1 (PSA 9)
- The Logic: The “Batting Cage” card. It tells the story of the first retirement. It’s iconic, unique, and historically significant. This card is currently undergoing a “Repricing Event.” The PSA 10 recently broke the psychological $1,000 barrier. When a card crosses a major threshold like that, it drags the lower grades up with it. This is the only card that captures the “White Sox Era.” As “The Last Dance” nostalgia ages into history, this specific chapter of Jordan’s career becomes more mythical. The PSA 9 is currently priced as a “novelty,” while the PSA 10 is priced as an “investment.” We are betting the PSA 9 will graduate to “investment” status.
- Purchase price: $80
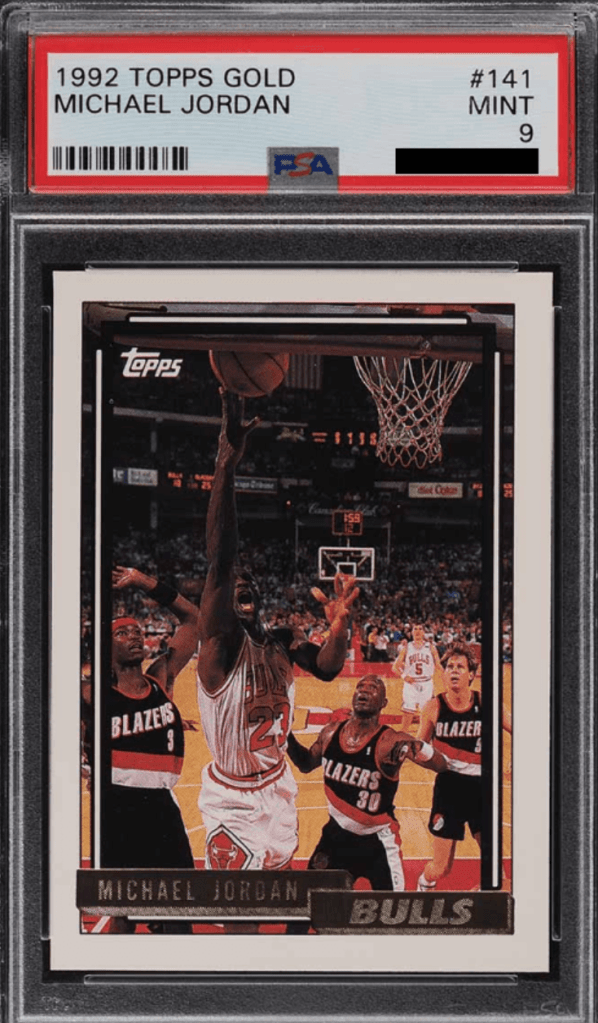
4. The Parallel Play: 1992 Topps Gold #141 (PSA 9)
- The Logic: Gold Foil parallels were the original “Refractor.” As modern collectors look back at the junk wax era, they crave scarcity. The ’92 Gold provides that. Modern collectors are obsessed with parallels (Prizms, Refractors, Holos). The 1992 “Topps Gold” is the ancestor of this behavior. For a $50 buy-in, you are acquiring a scarcity multiplier on the base set. As the “Junk Wax” stigma fades for specific subsets, “Gold” parallels are being treated as distinct, investable assets. A 9x spread for a parallel is too wide; we expect this to tighten to 4x-5x, pushing the card toward $100.
- Purchase price: $47.01
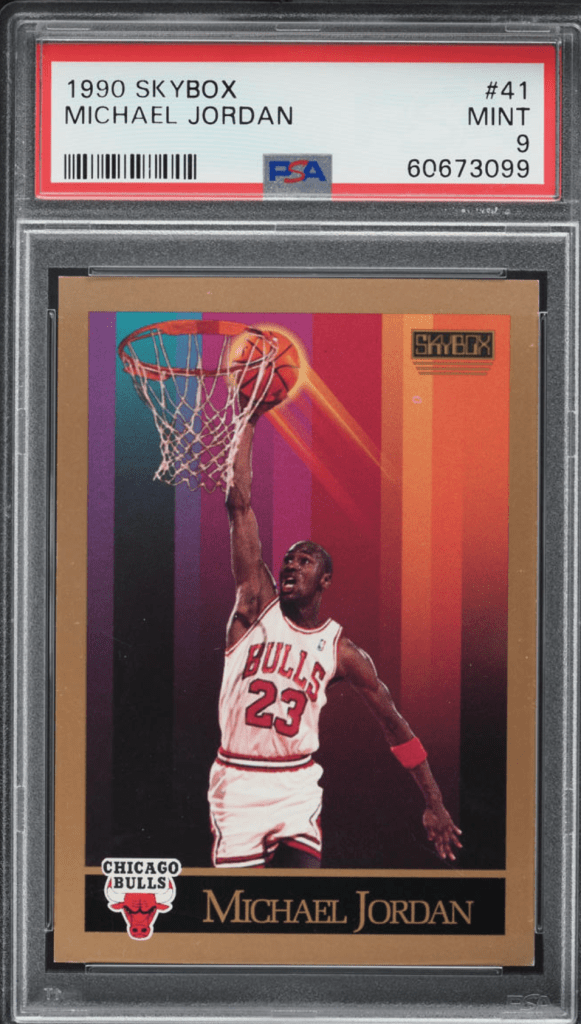
5. The Aesthetic Play: 1990 Skybox #41 (PSA 9)
- The Logic: The black border. The neon. It is the definitive image of 90s pop culture. It is an art piece as much as a sports card. This is arguably the most statistically broken metric in the portfolio. You are paying <$40 for a card that trades for $550 just one grade higher. The 1990 Skybox set has notoriously difficult black borders that chip easily, making 10s rare. We don’t need this card to hit $500. We just need the market to realize that a 15x gap is unsustainable. If the multiplier compresses to a “normal” 5x, this $35 card becomes a $110 asset overnight. It is a low-risk call option on the entire 90s aesthetic.
- Purchase price: $35
Remaining January Budget: ~$205.00
Recommendation: This 5-card lot secures key early-career slots and iconic parallels while keeping you well under the $125 per-card cap. I didn’t buy these cards because they are “cool.” I bought them because the Spread Metrics indicate they are currently mispriced by 50-200% relative to their Gem Mint siblings.
The Bottom Line
The data says the Jordan market has doubled. The volume says the liquidity is at an all-time high. By acquiring these five cards now, Cardvestr is positioned to capture the growth of the “Iconic Index” without the risk of carrying a single $10k asset.
We are effectively “long” on the Michael Jordan index with this move. The liquidity spike in late 2025 suggests we got in right as the frenzy is peaking, which is exactly where we want to be for maximum flip potential or long-term hold stability.
The trend is your friend. And right now, the trend is Air Jordan.
As always, you can view our entire portfolio on Card Ladder. We are all about transparency with who we are collecting and how we are doing.


Leave a comment