If you’re a data junkie like us, the latest GemRate Iconic Tracker & December 2025 Recap is pure adrenaline. We aren’t just looking at pretty charts; we are looking at the heartbeat of the hobby. And if this month’s data tells us anything, it’s that the card market isn’t just alive—it’s evolving at a breakneck pace.
We just finished a forensic review of the GemRate newsletter, and we need to talk about the numbers. Not the fluff, but the hard, jagged data points that should be driving your investment decisions in 2026.
Here is the full Cardvestr breakdown.
1. The Macro View: The “Hockey Stick” is Real
The headline number is impossible to ignore: 2.43 million cards graded in December 2025.
Let’s geek out on the Year-Over-Year (YoY) chart for a second. We are looking at a 49% increase in total grading activity compared to December 2024.
- The Trendline: If you look at the aggregate volume graph, the slope has steepened significantly. We aren’t seeing a plateau; we are seeing acceleration.
- The Implication: Despite economic headwinds or “junk slab” fears, the submission pipeline is wider than ever. This isn’t just TCG (though that’s a huge part of it); it’s a systemic expansion of the grading habit.
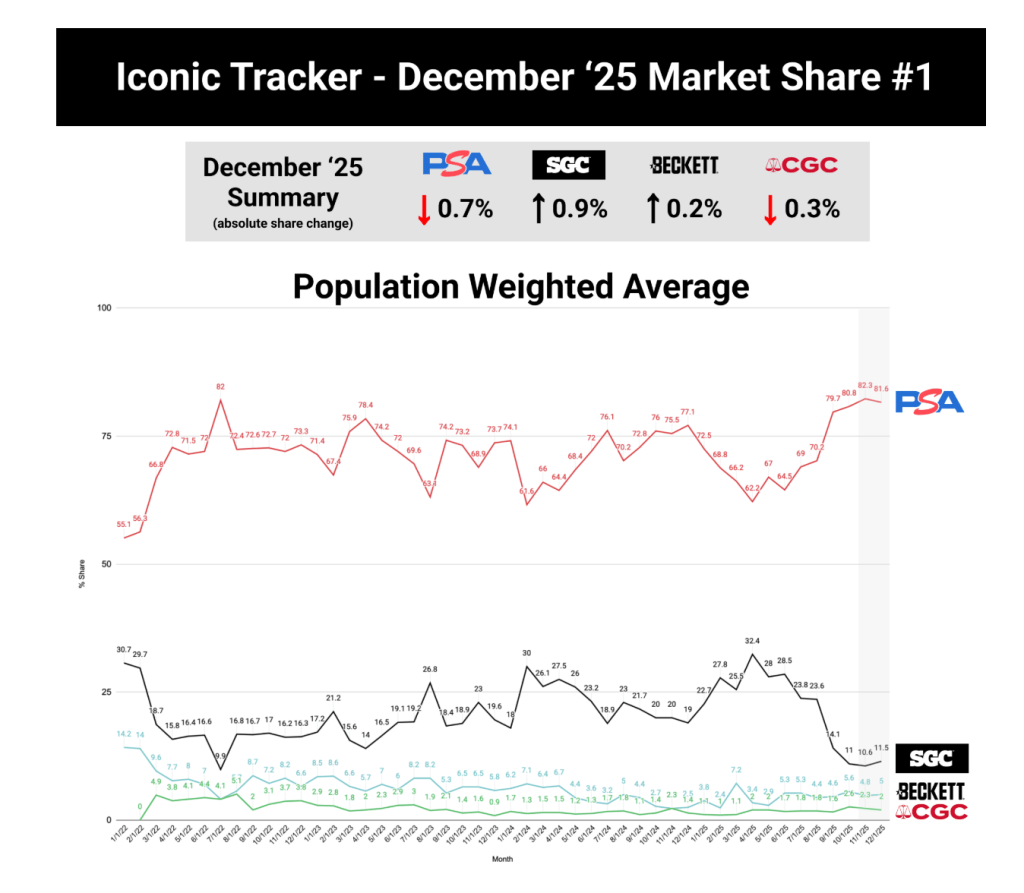
2. The “Big Four” Breakdown: Divergent Paths
The most fascinating graphs in the report are the company-specific trendlines. The market isn’t moving in unison; it’s splintering into specialized lanes.
PSA: The Unstoppable Juggernaut
- Volume: ~1.83 million cards.
- Growth: +11% Month-over-Month (MoM) and +50% YoY.
- The Chart: PSA’s bar chart looks like a skyscraper next to single-story homes. They are grading more cards in a month than their competitors do in a year combined. The data suggests PSA has successfully scaled operations to meet demand without collapsing turnaround times—a massive operational win.
CGC: The TCG Rocket Ship
- Volume: ~442k cards.
- Growth: +4% MoM and +99% YoY.
- The Data Point to Watch: That 99% YoY growth figure is the statistical MVP of this report. If you look at the market share pie chart, CGC is firmly cementing itself as the clear runner-up, driven heavily by Pokémon and TCG. They have effectively cornered the “high-volume, modern gaming” market.
Beckett (BGS): The “Lazarus” Chart
- Volume: ~72k cards.
- Growth: -3% MoM but +91% YoY.
- Analysis: This is the surprise of the report. For a while, the BGS graph looked like a slow bleed. But a 91% YoY jump signals a significant reversal. Whether it’s their label refresh or specific service level changes, the data shows Beckett is clawing back relevance, likely in the modern sports sector where the “Black Label” chase still holds weight.
SGC: The Vintage/Niche Contraction?
- Volume: ~41k cards.
- Growth: +17% MoM but -68% YoY.
- The Chart Concern: The SGC trendline is the only one flashing red on the YoY metric. A 68% drop is stark. However, the +17% MoM bump suggests they might have found a floor.
- Context: SGC’s graph likely reflects a “purification” of their customer base. They are the go-to for vintage sports (1950s-70s), but they seem to be losing the volume war on modern ultra-modern submissions to PSA and CGC.
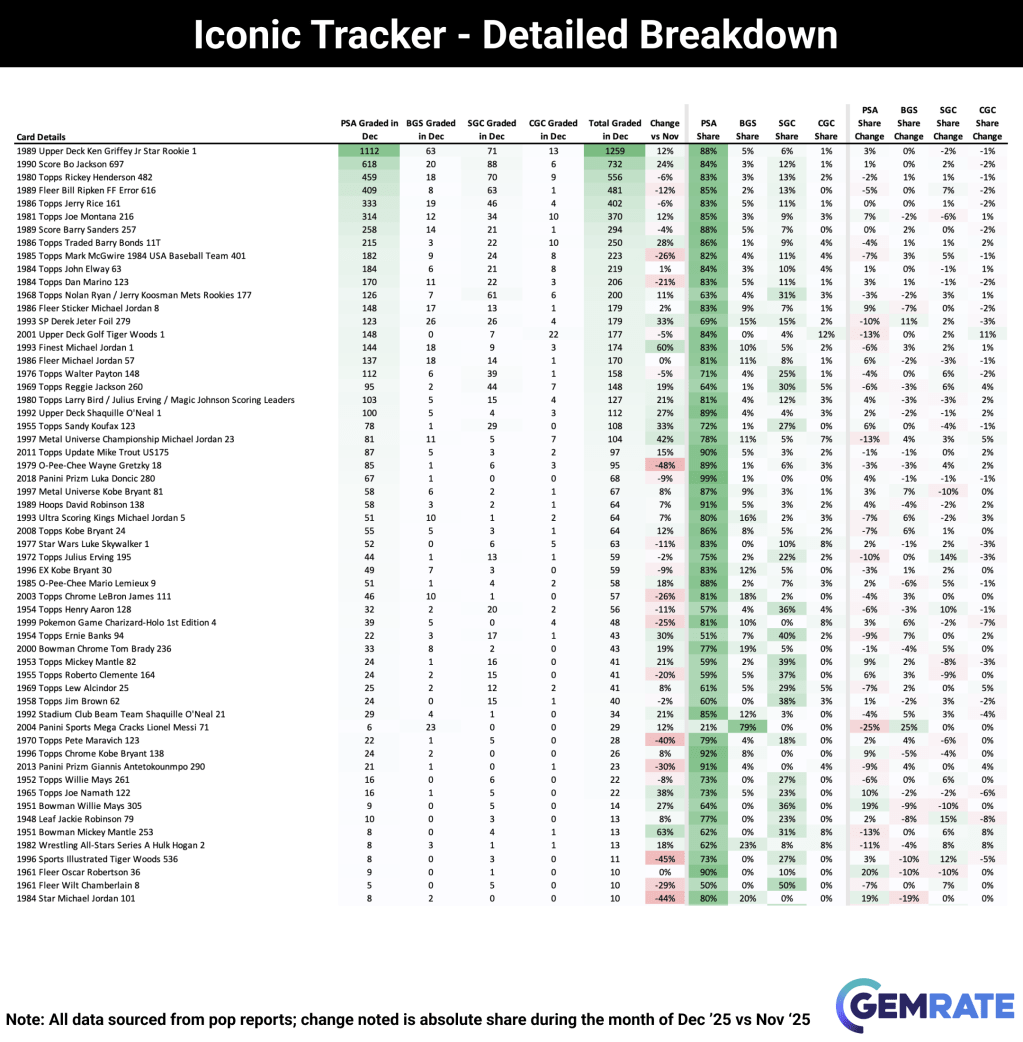
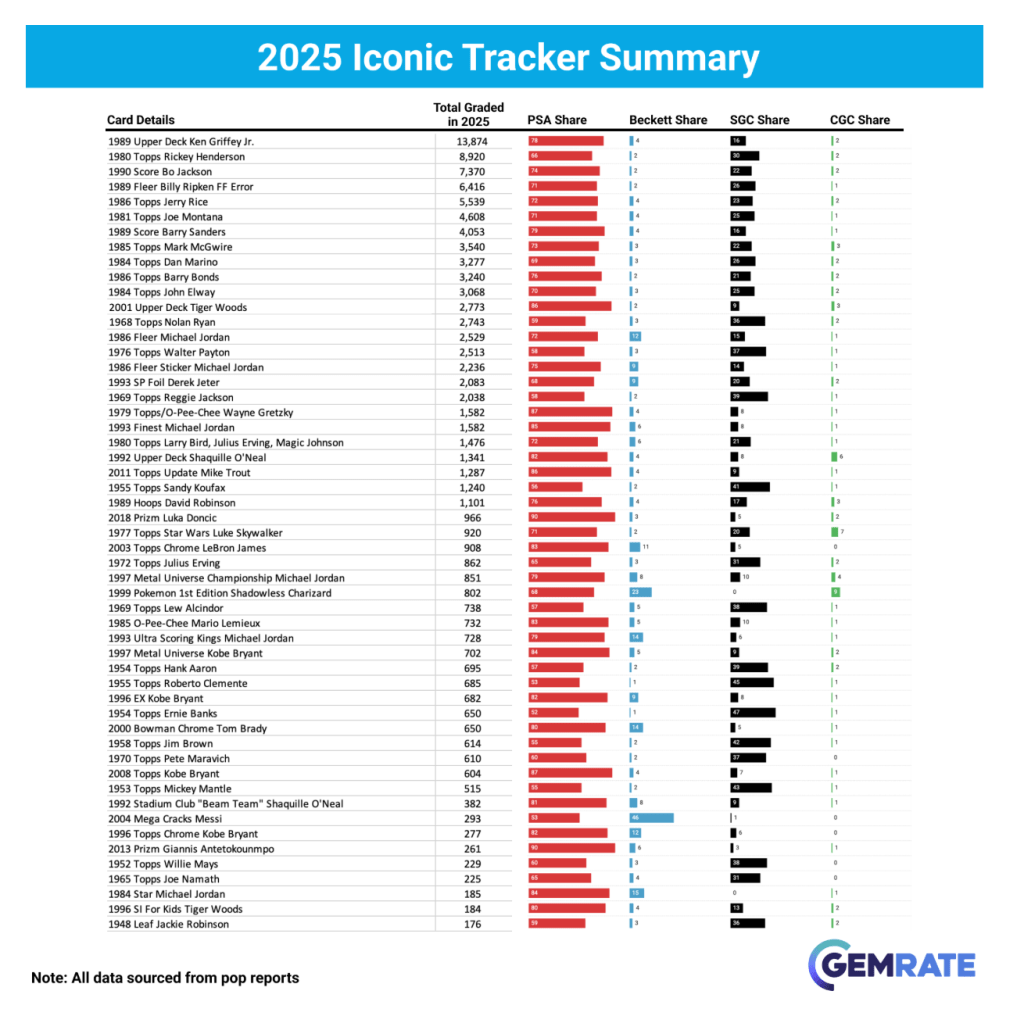
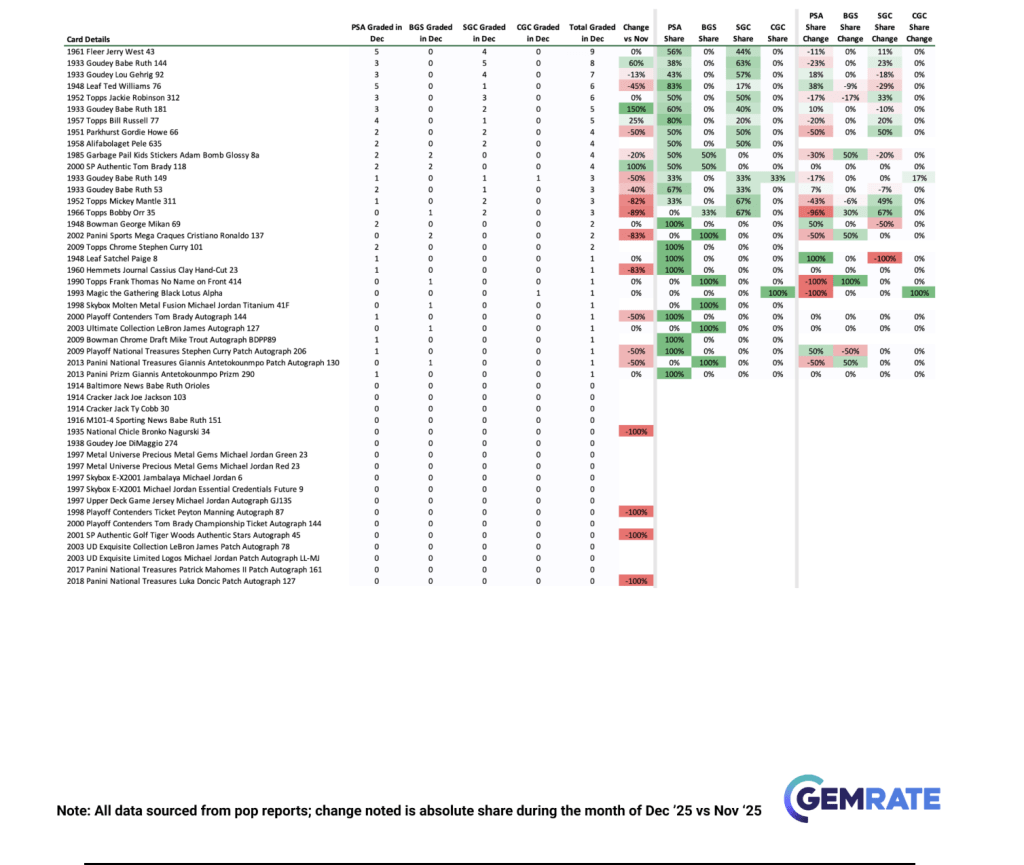
3. The “Iconic Tracker” Deep Dive
GemRate’s Iconic Tracker—which tracks the population growth of the hobby’s most culturally significant cards (think ’86 Fleer Jordan, ’52 Mantle, ’79 Gretzky)—adds a layer of “quality over quantity” to the data.
- The “Iconic” Market Share: Even when we strip away the bulk TCG submissions and focus only on the “Iconic 100” cards, PSA’s dominance is even more pronounced, holding nearly 70% of the total population for these blue-chip assets.
- The “Cross-Over” Myth: The data shows very little movement of iconic cards out of PSA slabs. If anything, the gravity of the PSA registry is pulling more vintage icons into their ecosystem.
- The Gretzky Metric: The report highlighted the 1979 O-Pee-Chee Wayne Gretzky Rookie. We saw over 300 of these graded in a single month recently. When you look at the population graph for a card this scarce in high grade, that kind of influx is statistically significant. It means raw copies are still being dug out of attics, or (more likely) collectors are cracking and resubmitting hoping for the bump.
4. Sports vs. TCG: The Hidden divergence
If you overlay the Sports vs. TCG graphs, you see two different economies.
- TCG (Pokémon/One Piece/Lorcana): This is the engine of volume. The vertical growth in CGC and PSA’s numbers is fueled by TCG.
- Sports: The sports graph is “choppier.” It’s seasonal (football spikes in winter, baseball in spring) and more sensitive to market value. The “Iconic Tracker” helps smooth this out by focusing on evergreen assets, but the broader sports grading data suggests a market that is becoming more selective.
Key Takeaways for Cardvestrs
- Don’t Bet Against Volume: The industry is growing, not shrinking. 2.43 million cards a month is a healthy ecosystem.
- CGC is Real: If you are investing in grading company stocks (or just deciding where to send TCG), the 99% YoY growth graph is undeniable. They are the volume king of the non-sports world.
- Vintage Stability: SGC’s contraction implies they are becoming a boutique vintage grader. This isn’t necessarily bad for values—SGC Tuxedos on vintage cards remain a liquid, trusted commodity—but they aren’t playing the “volume game” anymore.
Final Verdict:
The December 2025 graphs paint a picture of a maturing market. The “junk slab” era might be fading in favor of a “segmented slab” era, where each grading company has a distinct, statistically backed identity.
Keep tracking the data, and happy hunting.
(Data Source: GemRate December 2025 Iconic Tracker & Monthly Recap)


Leave a comment