I’m always scouring the web and reviewing all sorts of cards data. I was recently reviewing the Card Ladder CL Index 50. The indexes on Card Ladder below track the aggregate daily value movements of cards across various categories. The CL50 Index is like the S&P 500, made up of cards that were hand selected by our team. Use these indexes to research specific markets within the hobby to gauge where the markets are moving. The CL 50 is 50 hand-selected cards that best represent the card market.
Analyzing the provided data for the Card Ladder CL50, an index tracking 50 of the most iconic and high-profile trading cards across various categories (sports and gaming), reveals a market that is currently transitioning from a high-volatility peak into a period of stabilization as of January 15, 2026.
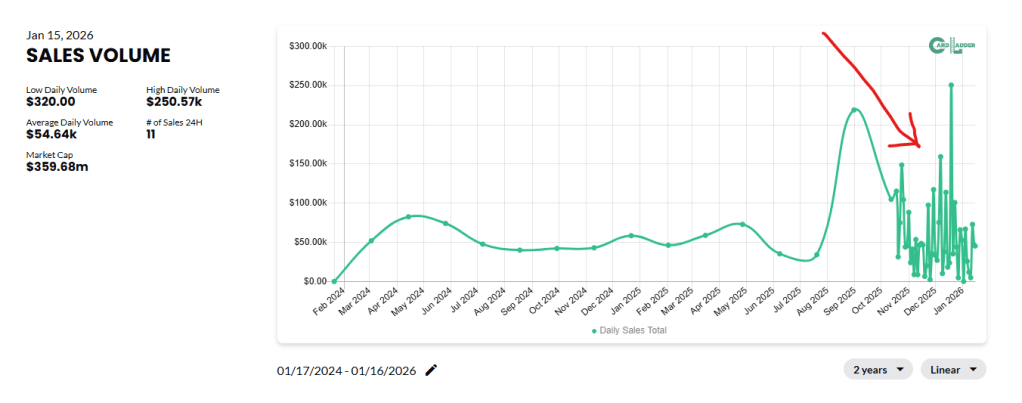
The CL50 Sales Index: 2-Year Snapshot
The index serves as a benchmark for high-end “blue-chip” assets, utilizing a normalized starting value to measure relative change over time.
- Market Cap: $359.68 million, reflecting the massive aggregate value of these elite assets.
- Average Daily Volume: $54.64k, which has seen a slight decline as the market moves away from the explosive growth of late 2025.
- Volitility Highlights:
- High Daily Volume: $250.57k. This extreme spike represents “Grail-level” transactions that occasionally inject massive liquidity into the index.
- Low Daily Volume: $320.00.
- Liquidity
- High liquidity between October 2025 and January 2026 as indicated in my red arrow. Relatively calm February 2024 to July 2025.
These three charts from Card Ladder provide a tiered look at the sales volume for a specific asset (likely a high-end trading card or a specific player’s market) as of January 15, 2026.
While the “Current” stats like Market Cap ($359.68m) and 24H Sales (11) remain constant, the Average Daily Volume shifts as you zoom out, telling a story of cooling momentum following a massive historical peak.
1. The Broad View (6-Month Chart)
This chart provides the necessary context for the current market state.
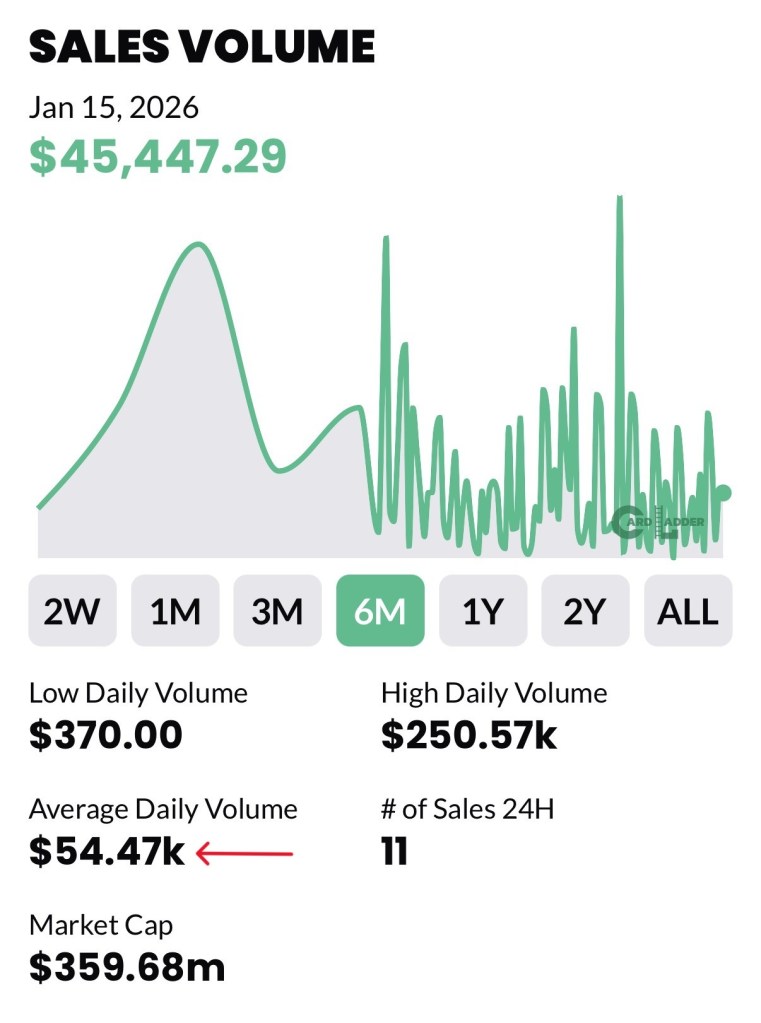
- The Massive Peak: On the left side of the 6M chart, there is a giant, smooth “mountain” of volume. This indicates a period of intense, sustained interest or a major market event (like a season opener, championship, or a specific high-grade card hitting the auction block).
- The Transition: After that peak, the volume becomes much more “jagged” or “noisy.” This suggests the market moved from a few massive, high-value transactions to more frequent, lower-value “retail” trades.
- Average Volume: The 6-month average is the highest of the three at $54.47k, buoyed significantly by that early historical surge.
2. The Mid-Term View (3-Month Chart)
Zooming into the last 90 days, we see the “aftermath” of the 6-month peak.
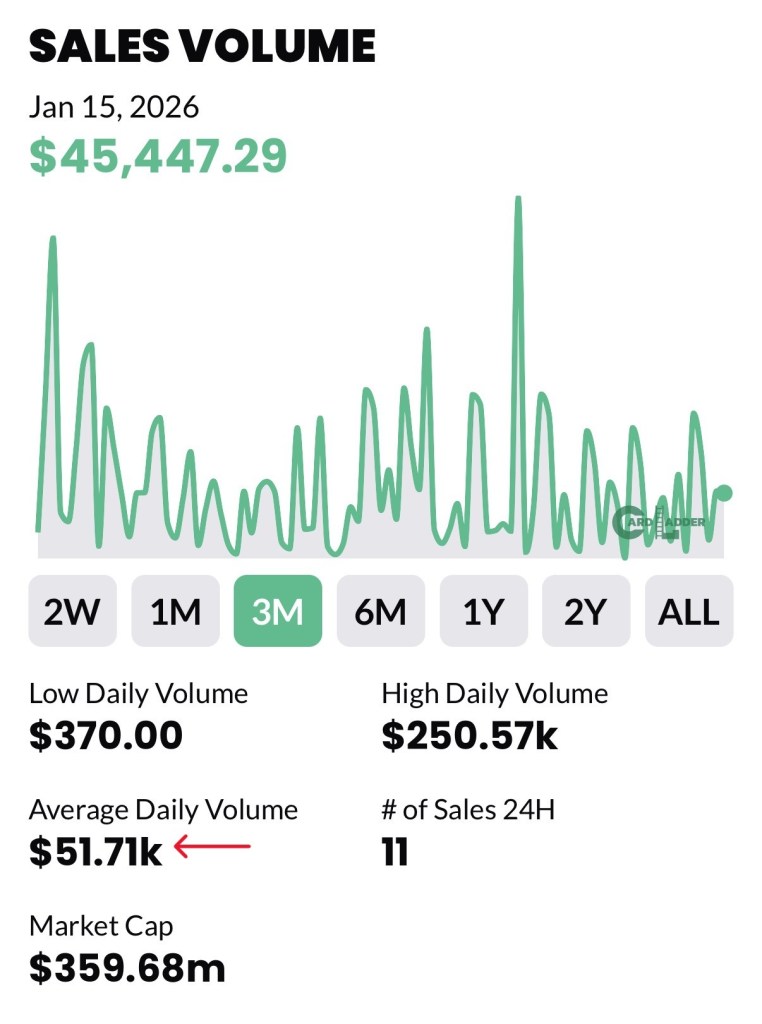
- Volatility: The 3M chart shows extreme “spikiness.” You can see the High Daily Volume of $250.57k represented by that tall needle in the middle-right.
- Slow Decline: The average daily volume drops to $51.71k. While there are still occasional big days, the “baselines” (the valleys between spikes) are getting lower, suggesting that demand is becoming more selective.
3. The Short-Term View (1-Month Chart)
This is the most “granular” look at recent activity.
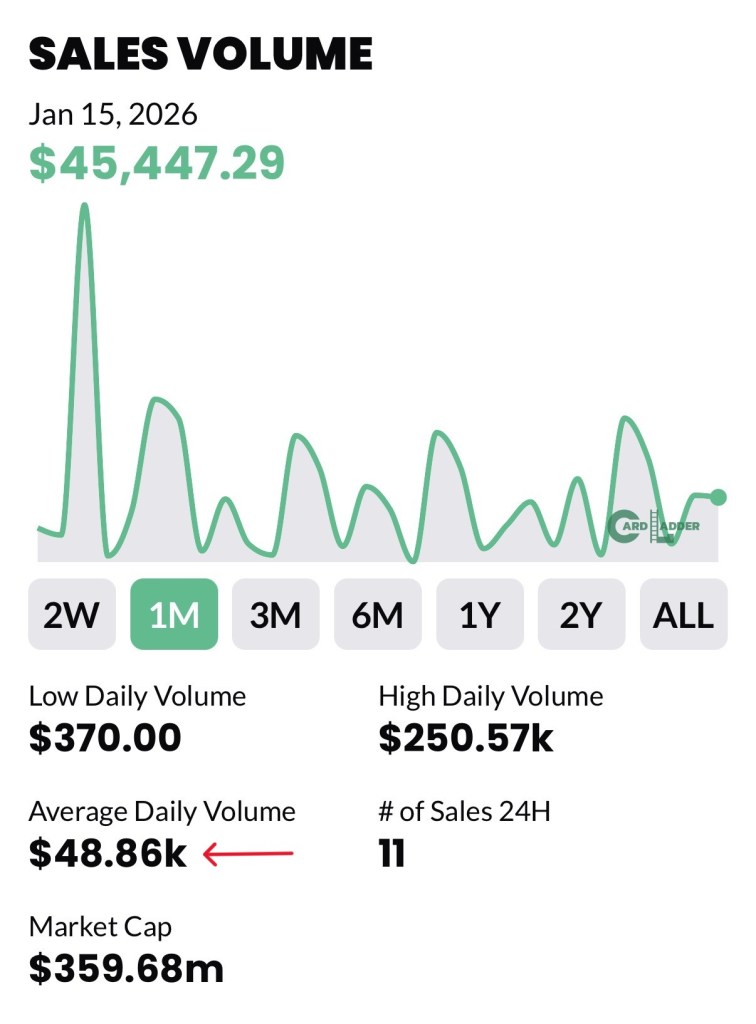
- Consolidation: The spikes are much lower than they were in the 3M or 6M views. The most recent “mountain” on the far left of this chart is significantly smaller than the ones seen months ago.
- Current Trend: The Average Daily Volume has fallen to its lowest point among the three charts at $48.86k.
- Recent Activity: The most recent data point (Jan 15) shows $45,447.29, which is slightly below the 1-month average. This indicates the market is currently in a “quiet” phase or a period of consolidation.
Summary Comparison Table
| Metric | 6-Month (6M) | 3-Month (3M) | 1-Month (1M) |
| Average Daily Volume | $54.47k | $51.71k | $48.86k |
| Trend Direction | Peak followed by drop | High volatility/spikes | Slowing/Lower highs |
| Market Sentiment | Historical Hype | Selective Buying | Cooling/Stability |
1. The “Main Event” (Early August – Mid September 2025)
Looking at the 6M Chart, the massive, rounded peak on the left corresponds to late summer 2025.
- The Cause: This aligns with the “biggest month on record” for the hobby (June-July 2025), where over $305 million was spent across marketplaces.
- The Spike: That large hump represents the tail end of this record-breaking surge, specifically fueled by high-end auctions like the Jordan-Kobe Dual Logoman sales ($13.17M) which set a psychological “floor” for high-end assets. The volume stayed high for weeks as collectors “chased” the next big sale.
2. The “Flash Spike” ($250.57k needle in the 3M Chart)
The High Daily Volume of $250,570 is a single-day outlier.
- Timing: This needle appears roughly 45–60 days ago (late November to early December 2025).
- The Cause: This is likely a “Grail” sale—a single card with a six-figure price tag hitting the public record. In late 2025, we saw massive movement in Prizm Football and Immaculate releases. A single high-grade Rookie Patch Auto (RPA) or a 1-of-1 “Shield” card selling for a quarter-million dollars would create exactly this kind of spike while the rest of the days remained at a lower “baseline.”
3. The “New Year Slump” (Jan 1 – Jan 15, 2026)
Looking at the 1M Chart, you can see the volume is much more subdued.
- The Cause: The market is currently distracted by a massive singular event: the auction of Logan Paul’s PSA 10 Pikachu Illustrator card, which was listed on January 5, 2026, and is expected to break $10 million.
- The Effect: When a “Category Killer” card like that is at auction, liquidity often dries up elsewhere. High-end buyers “park” their capital to see where the record-breaking price lands before committing to other big purchases. This is why your Average Daily Volume has dropped from $54k (6M) down to $48k (1M).
The “Big Picture” Conclusion
The market for this asset is currently cooling off. The 6-month average is roughly 11.5% higher than the current 1-month average.
This typically suggests that a major catalyst occurred 4–6 months ago, and while the “Market Cap” remains a massive $359.68 million, the actual liquidity (daily trading) is drying up. Investors are holding, but new buyers are not chasing the price with the same fervor they had last year.


Leave a comment