At Cardvestr, we are always looking for ways to help you make smarter, more strategic investment decisions. One powerful tool in your arsenal? Analyzing card price graphs and recognizing patterns over time using free AI tools
Let’s walk through a real-world example.
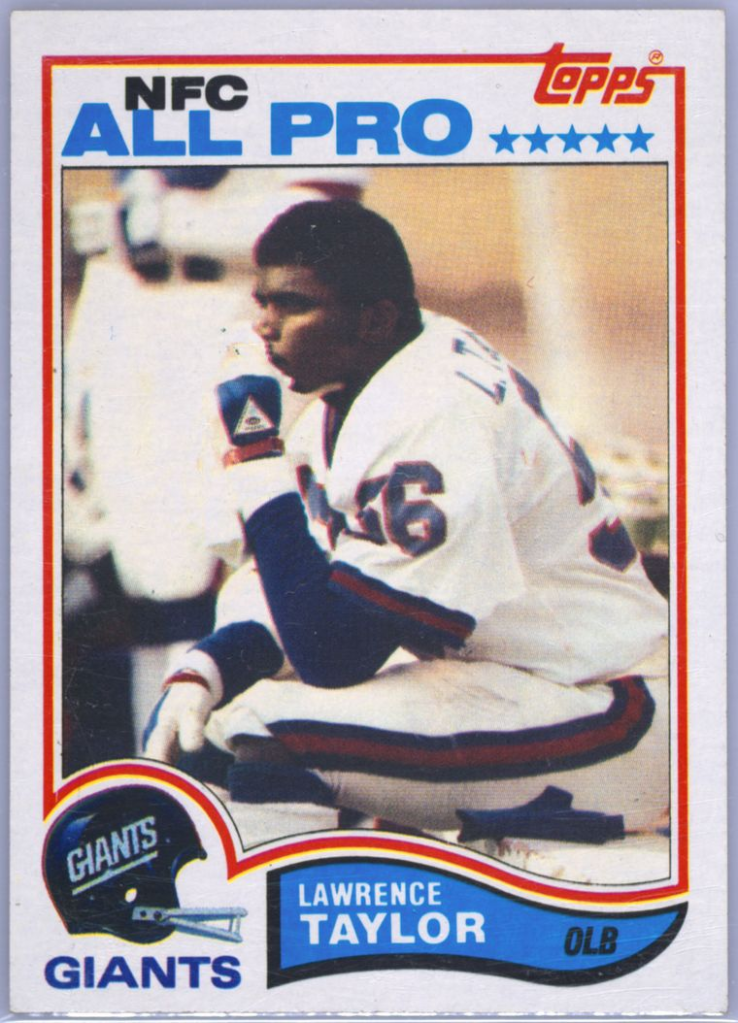
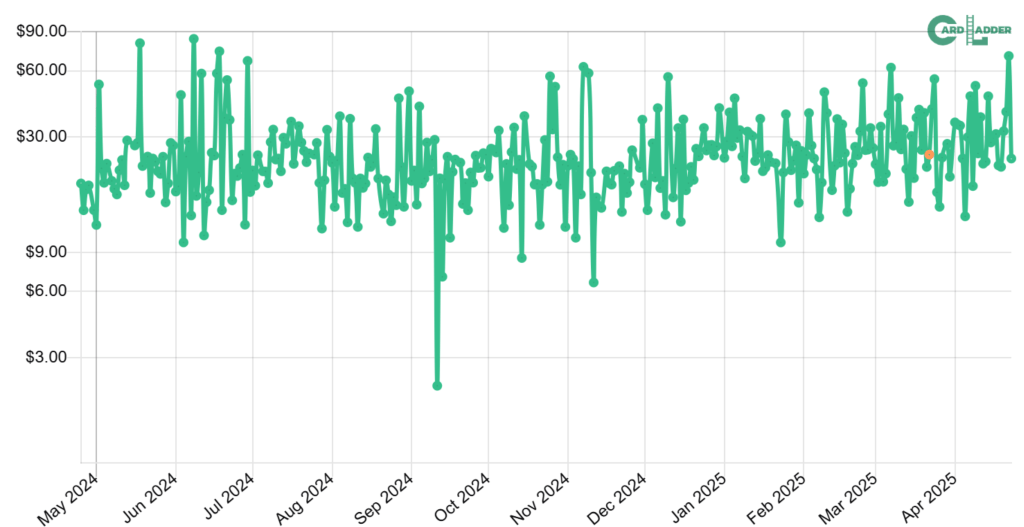
Recently, we ran the Lawrence Taylor 1982 Topps #434, spanning from May 2024 to April 2025. The graph showed a volatile but fairly consistent fluctuation between high $80s and low $30s. Prices bounced up and down almost like a heartbeat, offering sharp opportunities for savvy investors.
Key Observations:
- Price Range: Fluctuates between $3 and $90, but most activity is between $20 and $40.
- Trend: A slight overall upward trend, meaning that the “floor” price slowly increased over time.
- Volatility: Frequent, sharp price swings ideal for short-term buying and selling.
When Were the Best Times to Buy?
- Late September to Early October 2024
- One of the lowest points on the graph, just above $3. Buying here would have offered massive upside.
- November & December 2024
- Multiple dips under $10–$15 provided strong buy-low opportunities before quick rebounds.
- February 2025
- Minor dips below $20 that quickly corrected upward, presenting easy flip opportunities.
Smart Strategy for a Volatile Card:
- Set automated alerts to buy under $20-$25.
- Sell during upward spikes between $50-$60.
- Hold long-term if the upward trend remains steady.
Why This Matters for Investors
Using data like this isn’t just “nice to have”—it’s essential. Recognizing buying windows and market patterns can dramatically boost your ROI. Instead of chasing hype or making emotional decisions, you can build a disciplined approach based on real market behavior.
The Bottom Line
When you use graph analysis as part of your sports card investing strategy, you’re turning investing from a gamble into a calculated, repeatable system. Data is your edge!
Ready to level up your card investments? Start studying those graphs!


Leave a comment